Showing posts with label Climate. Show all posts

Tuesday, February 23, 2010

Inhofe Weighs Criminal Probe of Scientists’ Climate Change E-Mails

FOXNews.com
February 23, 2010

The Senate’s top global warming skeptic on Tuesday is calling for a possible criminal investigation into the scientists accused of manipulating the data once used as the centerpiece of international climate change research.

Sen. James Inhofe, R-Okla., is considering a request to the Department of Justice for a probe of scientists who he claims deliberately falsified data used by climate change advocates. He is also planning on grilling Environmental Protection Agency administrator Lisa Jackson at a hearing Tuesday morning about her decision to rely on information from the U.N.’s International Panel on Climate Change to institute an endangerment finding that gives the EPA authority to regulate greenhouse gases.

Inhofe is releasing a 40-page report that will be used by Republicans to answer how she can continue to advocate for new global warming regulations even as the findings by the IPCC and the work of the East Anglia Climate Research Unit in Britain create doubt about climate science.

Read entire article

75 Reasons to be Skeptical of "Global Warming"


Global Research, February 23, 2010
joshfulton.blogspot.com - 2010-02-21

* Carbon dioxide contributes to only 4.2 - 8.4% of the greenhouse gas effect

* Only approximately 4% of carbon dioxide is man-made

* Water vapor accounts for 90 - 95% of the green house gas effect


* 99.99% of water vapor is natural, meaning that no amount of deindustrialization could get rid of it


* There have been many times when the temperature has been higher than it is now including the Medieval Warming Period, the Holocene, the Jurassic, and the Eemian

* Increases in carbon dioxide follow increases in temperature by about 800 years, not precede them


* Phil Jones of the Hadley CRU, and key figure in the "climategate" scandal, admits that there has been no "statistically significant" global warming since 1995

* 2008 and 2009 were the coolest two years of the decade

* During the Ordovician period carbon dioxide concentrations were twelve times what they are now, and the temperature was lower

* Solar activity is highly correlated with temperature change:


* Studies show that half of all recent warming was solar

* Mars has warmed about 0.5°C since the 1970's, approximately the same that earth has warmed over the same period

* The 0.7°C increase in temperatures over the last century is entirely consistent with well-established, long-term, natural climate trends


* The distance between Earth and Sun changes every year, affecting the amount of energy the earth receives


* Earth’s tilt oscillates between 21.4° and 24.8°, which affects the distribution of the sun's energy

* Dr. Roy Spencer has written that clouds have been a more important driver of climate than carbon dioxide since 2000

* Approximately 40% of the uncertainty in temperature projections come from uncertainty in the strength of the "feedback loop" between temperature and carbon dioxide. Recent research suggests the "feedback loop" is less than half as strong than many had presumed

* James Hansen of NASA said in a simulation of temperatures from 1880 to 2000 soot accounted for 25% of observed global warming

* Research suggests that soot could have nearly as much impact on climate change as carbon dioxide


* Antarctica has 90% of earth's ice and it is growing

* Arctic sea ice has returned to 1979 levels, which is when records began

* The Arctic ice caps have recovered from their loss in 2007

* The Arctic is now 1°C cooler than it was in the 1940's

* Polar bear populations are increasing

* Polar bears are able to swim over 60 miles continuously

* Sea level 81,000 years ago was 1 meter higher than it is now while carbon dioxide levels were lower

* A chart of sea level change over millions of years looks like this:


* According to satellite data, sea level has been decreasing since 2005

* Instead of hurting forests, the increased level of carbon dioxide has been helping them grow

* The official "record" for temperatures only goes back 150 years

* Although the IPCC may have 2500 members, only approximately 800 contribute to the scientific writing of the report

* Only 52 scientists contributed to the 2007 IPCC summary for policy makers, although diplomats from over 115 countries contributed

* Only 20% of the members of the IPCC deal with climate science

* Head of the IPCC, Dr. Rajendra Pachauri has no background in climate science. His PhD is in economics and he worked as a railway engineer before becoming head of the IPCC


* Former IPCC lead author Ben Santer openly admits that he altered portions of the 1995 IPCC report to make them "consistent with the other chapters"

* John Christy, former lead author on the 2001 IPCC report, speaks of his former co-lead authors deliberately trying to sensationalize the report

*Richard Lindzen, another lead author on the 2001 IPCC report, accused the IPCC of being "driven by politics"

* Michael Mann's "hockey stick" graph, which was featured prominently in the 2001 IPCC report, was created using only portions of a data set. The red line is the graph of Mann's selected data, while the black line is the graph of all the data:


* When asked to act as an expert reviewer on the IPCC's last two reports, Dr. Nils Axel-Morner was "astonished to find that not one of their 22 contributing authors on sea levels was a sea level specialist"

* Until 2003, the IPCC's satellite-based evidence showed no upward trend in sea level, so they used an increase of 2.3mm in one Hong Kong tide-gauge to adjust the entire global sea level up 2.3mm

* The IPCC's claim that the Himalayan glaciers were melting was based off of a phone interview with a non-scientist. They were forced to retract the claim

* The IPCC claim that global warming was led to increased natural disasters was based on an unpublished report that had not been subject to peer-review. They were forced to retract the claim

* The IPCC's claim that global warming was going to lead to deficiencies of up to 50% in African agriculture was based on a non-peer-reviewed and non-scientific paper. They were forced to retract the claim

* The IPCC's claim that "up to 40% of the Amazonian forests could react drastically to even a slight reduction in precipitation" was based on a non-peer-reviewed and non-scientific paper. They were forced to retract the claim

* The IPCC reported that 55% of the Netherlands was below sea level when just 26% of the country is below sea level. They were later forced to retract the claim

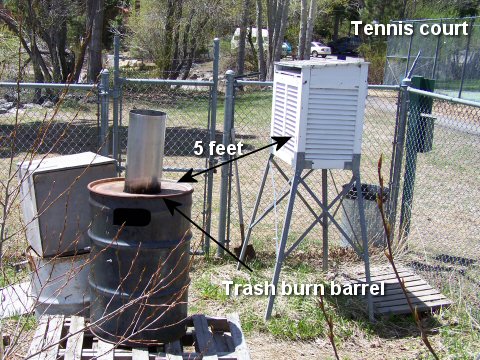
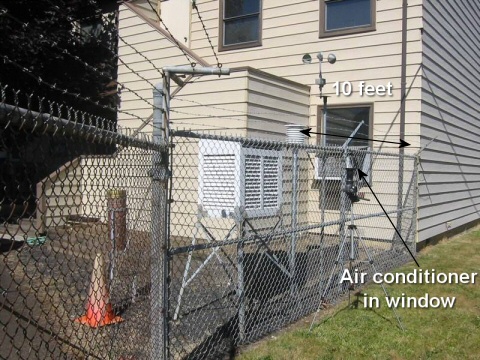
* According to the United States Historical Climatology Network (USHNC,) 90% of US climate-monitoring surface stations have been found to be "poorly situated," meaning that they have a margin of error greater than 1°C, more than the global warming in the entire 20th century. (The US surface data is generally considered the best surface data in the world):


* Many climate-monitoring surface stations are in locations that look like this:


* Temperature measurements from climate-monitoring surface stations are collected by hand. At one surface station in California, Anthony Watts found that only data from 14 out of 31 days had been completed in a month

* If a surface station is missing data for a particular day, data from surrounding surface stations is used to fill-in. Since 90% of all surface stations are poorly situated, even if a surface station itself is not poorly situated, if its data is missing for a day, there is a very good chance its temperature will be calculated using data from surface stations that are poorly situated

* In April 1978, there were 6,000 climate-monitoring surface stations. There are now about 1,200

* The vast majority of climate-monitoring stations that were lost were rural ones, which have been shown to give the most accurate data:


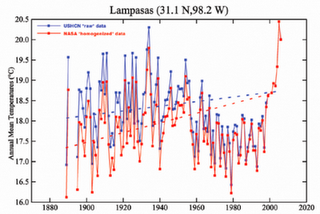
* The raw data is "adjusted" by a computer program. The net effect of this "adjustment" has been to increase the "adjusted" numbers over the "raw" numbers by .5°F, an increase that has been growing year by year:


* Difference between the USHCN "raw" data (in blue) and NASA "homogenized" data (in red):


* According to a leaked email in "climategate," "temperatures in Darwin [a monitoring station in Australia] were falling at 0.7 Celsius per century […]but after the homogenization, they were warming at 1.2 Celsius per century. [...][W]hen those guys “adjust,” they don’t mess around."

* According to a leaked email in "climategate," computer programmer Harry Harris called the CRU data set "hopeless," and said "the rest of the databases seem to be in nearly as poor a state as Australia was. [...]This whole project is SUCH A MESS. No wonder I needed therapy!!"


* When looking at source code leaked in "climategate" used to "process" and "adjust" temperatures, software engineer John Graham-Cumming said he found at least five errors and "wouldn't trust it"

* The Hadley CRU, the institution at the center of the "climategate" scandal, threw out original temperature data because it claimed it did not have "storage space"

* In 1990, Dr. Phil Jones, the man at the center of the "climategate" scandal, contributed to a paper arguing that the effect of urban warming in eastern China was "negligible." This became a key reference source for the IPCC. It turns out that 49 of the 84 climate-monitoring stations used for this report had no history of their locations or other details. This included 40 of the 42 rural stations. Of the rest, 18 had "certainly been moved" during the study period, including one that was moved five times over a total distance of 41 km. When Jones "re-examined" data in the same area for a 2008 paper, he found that urbanization was responsible for 40% of the warming found from 1951 to 2004

* Ross McKitrick and Patrick Michaels have argued that half of the global warming trend from 1980 to 2002 is caused by urban warming

* The Hadley CRU has been accused of using data from just 25% of Russia's surface stations, deliberately overstating Russia's warming by .64°C between the 1870's and 1990's

* According to emails leaked in "climategate," when "Climate Research" published articles by global warming skeptics, Phil Jones and others urged scientists to "stop considering 'Climate Research' as a legitimate peer-reviewed journal"

* William Connolly, a Wikipedia administrator and co-founder of Realclimate.org, a website that supports the theory of anthropogenic global warming, "touched" over 5,400 Wikipedia articles, routinely omitting voices that were skeptical of global warming

* Large computer climate models are unable to even simulate major features of past climate such as the 100 thousand year cycles of ice ages that have dominated climate for the past 700 thousand years

* This is a picture of what Britain looked like in the summer of 2009 when its sophisticated climate "supercomputer" had predicted a "barbeque summer":


* The US government spends over $2.5B funding climate research every year, and over $7B when grants for technology, tax breaks, and foreign aid are included (this is while Exxon gave $22M to global warming skeptics over a 10 year period)

* Many scientist assert that government grant money is given preferentially to advocates of man-made global warming

* Bart Chilton, a CFTC commissioner, said "carbon markets could be worth $2 trillion in transaction value – [...]within five years of trading (starting). [...]That would make it the largest physically traded commodity in the US, surpassing even oil"

* The owners of the trading floor where the carbon credits will be traded, including Goldman Sachs and Al Gore, stand to earn trillions if cap-and-trade is passed


* The cap-and-trade bill allows the government police powers to come into your home and inspect it for "energy efficiency," and to fine you every day your home is not compliant


* Australian homes now have to undergo a mandatory energy-efficiency assessment - costing up to $1500 per property - before they can be sold or rented under new laws to tackle carbon emissions

* UN Secretary General Ban Ki-Moon has called for "global governance structure" to monitor greenhouse gases, which everyone on the planet emits with every exhale


* The United Nations forecasts that the global population will rise, peak and then decline between 2050 and 2300 to just under 9 billion

* Despite proclamations that there is a "consensus" and the debate is "settled," 18% of scientists surveyed in the last poll trying to discern scientific opinion do not believe in man-made global warming

* 45% of Americans think global warming is man-made, down 9% from just half a year earlier

* In the court case Dimmock v Secretary of State for Education and Skills, a British judge ruled that there were nine "inaccuracies" in An Inconvenient Truth, including Gore's claim that sea level could rise by up to 20 ft. The IPCC's own report predicted a maximum rise of 59cm in sea level over 100 years. The Science and Public Policy Institute has taken issue with thirty five of Gore's claims in An Inconvenient Truth

* Al Gore bought a $4M condo feet from ocean in Fisherman's Wharf, San Fransisco, a city he had explicitly warned about in An Inconvenient Truth


Wednesday, February 17, 2010

UN Climate Panel Admits Dutch Sea Level Flaw

Posted by bluemana on February 17, 2010

UN FlagReported via Reuters:

OSLO — The UN panel of climate experts overstated how much of the Netherlands is below sea level, according to a preliminary report on Saturday, admitting yet another flaw after a row last month over Himalayan glacier melt.

A background note by the Intergovernmental Panel on Climate Change (IPCC) said a 2007 report wrongly stated that 55 percent of the country was below sea level since the figure included areas above sea level, prone to flooding along rivers.

The United Nations has said errors in the 2007 report of about 3,000 pages do not affect the core conclusions that human activities, led by burning fossil fuels, are warming the globe.

“The sea level statistic was used for background information only, and the updated information remains consistent with the overall conclusions,” the IPCC note dated February 12 said.

Skeptics say errors have exposed sloppiness and over-reliance on “grey literature” outside leading scientific journals. The panel’s reports are a main guide for governments seeking to work out costly policies to combat global warming.

Read More: Reuters

Monday, January 25, 2010

Climategate update: ‘The wheels are coming off for the IPCC’

E. Thomas McClanahan
Kansas City Star Editorial
January 25, 2010

The UN’s Intergovernmental Panel on Climate Change is supposed to represent the unimpeachable view of science. Now we’re learning just how sloppy it’s methods have been. First came the revelation that the prediction on melting Himalayan glaciers was unverified. Now comes a report that the UN wrongly linked global warming to natural disasters.

What’s happening is that after the Climategate e-mail revelations, skeptical views from credentialed scientists — dismissed or suppressed up to now — are getting a second look. In other words, the wheels are coming off for the IPCC.

All in all, not a good week for the IPCC. Two major errors, both of them integrating inflammatory, un-reviewed results into what had been advertised as the most authoritative peer-reviewed summary of the state of climate science. This follows the collapse of Copenhagen, and the Climategate emails’ evidence of pressure to influence the results of climate science. All of them working in the same direction: to slant the evidence presented to the world toward the conclusion that AGW is a current crisis, a world cataclysm.

Wednesday, January 6, 2010

Big Chill: Coldest Weather in Over Two Decades

Infowars.com
January 6, 2010

Global warming? What global warming? How will Al Gore explain this?

Big chill

From AccuWeather:

Nearly the entire eastern half of the United States is enduring bitterly cold temperatures not experienced since 1985. Even Florida, which has been hovering around freezing levels overnight recently, is also feeling the almost-nationwide chill.

“It’ll be like the great winters of the ’60s and ’70s,” said AccuWeather.com Chief Meteorologist and Expert Long Range Forecaster Joe Bastardi.

The last time a large swath of severely low temperatures struck the nation was in January 1985. That historic arctic outbreak had below-zero temperatures Fahrenheit stretching from Chicago eastward to New York City, and all the way south to Macon, Ga.

Read entire article

Sunday, January 3, 2010

Fast Pace of Glacier Melt in the 1940s: Lower Aerosol Pollution

ScienceDaily
Saturday, Jan 2nd, 2010

The most recent studies by researchers at ETH Zurich show that in the 1940s Swiss glaciers were melting at an even-faster pace than at present. This is despite the fact that the temperatures in the 20th century were lower than in this century. Researchers see the main reason for this as the lower level of aerosol pollution in the atmosphere.

In Switzerland, the increase in snow in wintertime and the glacier melt in summertime have been measured at measurement points at around 3,000 metres above sea level — on the Clariden Firn, the Great Aletsch glacier and the Silvretta glacier — without interruption for almost 100 years. As part of his doctoral work, Matthias Huss used this unique range of measurements to examine how climate change in the last century affected the glaciers. The work was carried out under the supervision of Martin Funk, professor and head of the Department for Glaciology at the Laboratory for Hydraulics, Hydrology and Glaciology (’VAW’) at ETH Zurich, who is also co-author of the study.

Solar radiation as the decisive factor

In its work, the research team took into account the solar radiation measured on the Earth’s surface in Davos since 1934. Studies over the past two decades have shown that solar radiation varies substantially due to aerosols and clouds, and this is assumed to influence climate fluctuations. Recent years have seen the emergence of the terms ‘global dimming’ and ‘global brightening’ to describe these phenomena of reduced and increased solar radiation respectively. These two effects are currently the subject of more and more scientific research, in particular by ETH Zurich, as experts feel that they should be taken into account in the climate models.

The new study, published in the journal ‘Geophysical Research Letters’, confirms this requirement. This is because, taking into account the data recorded for the level of solar radiation, the scientists made a surprising discovery: in the 1940s and in the summer of 1947 especially, the glaciers lost the most ice since measurements commenced in 1914. This is in spite of the fact that temperatures were lower than in the past two decades. “The surprising thing is that this paradox can be explained relatively easily with radiation,” says Huss, who was recently appointed to the post of senior lecturer at the Department of Geosciences at the University of Fribourg in Switzerland.

Full article here

Tuesday, August 4, 2009

Global warming is the new religion of First World urban elites


Jonathan Manthorpe
Vancouver Sun
July 29, 2009


Ian Plimer has outraged the ayatollahs of purist environmentalism, the Torquemadas of the doctrine of global warming, and he seems to relish the damnation they heap on him.

Plimer is a geologist, professor of mining geology at Adelaide University, and he may well be Australia’s best-known and most notorious academic.

Plimer, you see, is an unremitting critic of “anthropogenic global warming” — man-made climate change to you and me — and the current environmental orthodoxy that if we change our polluting ways, global warming can be reversed.

It is, of course, not new to have a highly qualified scientist saying that global warming is an entirely natural phenomenon with many precedents in history. Many have made the argument, too, that it is rubbish to contend human behaviour is causing the current climate change. And it has often been well argued that it is totally ridiculous to suppose that changes in human behaviour — cleaning up our act through expensive slight-of-hand taxation tricks — can reverse the trend.

Read entire article

Sunday, August 2, 2009

World’s Largest Science Group Rejecting Man-made Climate Fears

Marc Morano
NewsWithViews
August 1, 2009

An outpouring of skeptical scientists who are members of the American Chemical Society (ACS) are revolting against the group’s editor-in-chief — with some demanding he be removed — after an editorial appeared claiming “the science of anthropogenic climate change is becoming increasingly well established.”

featured stories   Worlds Largest Science Group Rejecting Man made Climate Fears
chan
An outpouring of skeptical scientists who are members of the American Chemical Society (ACS) are revolting against the group’s editor-in-chief.

The editorial claimed the “consensus” view was growing “increasingly difficult to challenge, despite the efforts of diehard climate-change deniers.” The editor now admits he is “startled” by the negative reaction from the group’s scientific members. The American Chemical Society bills itself as the “world’s largest scientific society.”

The June 22, 2009 editorial in Chemical and Engineering News by editor in chief Rudy Baum, is facing widespread blowback and condemnation from American Chemical Society member scientists. Baum concluded his editorial by stating that “deniers” are attempting to “derail meaningful efforts to respond to global climate change.”

Dozens of letters were published on July 27, 2009 castigating Baum, with some scientists calling for his replacement as editor-in-chief.

The editorial was met with a swift, passionate and scientific rebuke from Baum’s colleagues. Virtually all of the letters published on July 27 in castigated Baum’s climate science views. Scientists rebuked Baum’s use of the word “deniers” because of the terms “association with Holocaust deniers.” In addition, the scientists called Baum’s editorial: “disgusting”; “a disgrace”; “filled with misinformation”; “unworthy of a scientific periodical” and “pap.”

Read entire article

Tuesday, May 26, 2009

Why I am a Climate Realist

Dr Willem de Lange

23 May 2009

 In 1996 the United Nations Intergovernmental Panel on Climate Change’s (IPCC) Second Assessment Report was released, and I was listed as one of approximately 3000 “scientists” who agreed that there was a discernable human influence on climate.

I was an invited reviewer for a chapter dealing with the economic impact of sea level rise on small island nations. In keeping with IPCC procedures, the chapter was written and reviewed in isolation from the rest of the report, and I had no input into the process after my review of the chapter draft. I was not asked if I supported the view expressed in my name, and my understanding at the time was that no evidence of a discernable human influence on global climate existed.

The chapter I reviewed dealt primarily with the economic consequences of an assumed sea level rise of 1 m causing extensive inundation. My response was that I could not comment on the economic analysis, however, I disagreed with the initial assumptions, particularly the assumed sea level rise in the stated time period. Further, there was good evidence at the time that sea level rise would not necessarily result in flooding of small island nations, because natural processes on coral atolls were likely to raise island levels.

The IPCC Second Assessment Report assessed sea level rise by AD 2100 as being in the range 0.20-0.86 m, with a most likely value of 0.49 m (less than half the rate assumed for the economic analysis). Subsequent research has demonstrated that coral atolls and associated islands are likely to increase in elevation as sea level rises. Hence, the assumptions were invalid, and I was convinced that IPCC projections were unrealistic and exaggerated the problem.

Following the release of IPCC Second Assessment Report I also co-authored the sea level rise section of the New Zealand impact report, and same section for a revised report following the release of IPCC Third Assessment Report (2001). The third report followed the trend of decreasing sea level rise projections evident in sea level rise literature, with a most likely projection of 0.44 m. However, some extreme scenarios were added at a late stage of the review process to give a wider range of projections from 0.09-0.88 m. There was little support in the literature for these extremes, and my view was that a range of 0.31-0.49 m was more reasonable. I also expected future projections to be lower.

For the New Zealand 2001 report, I was asked to state that sea level rise was accelerating, or at least could be accelerating. However, my own research and published literature shows that sea level fluctuates at decadal time scales. Therefore, although there was an increase in the rate of sea level rise around 1998, I expected sea level rise to slow and reverse early in the 21st Century. The underlying long-term trend, however, was likely to decrease, and there were some tide gauge data to indicate that it had started to do so. In the 1980s, the New Zealand rate was 1.8 mm per year. By 1990, it was 1.7 mm per year, and by 2001 it was 1.6 mm per year. These changes are small, and were not enough to prove that sea level rise was slowing. However, they clearly did not show that sea level rise was accelerating.

After 2001, published studies continued to project lower global sea level rises over the 21stCentury, and several reported a slowing of the rate of rise during the 20th Century. Shortly before the IPCC Assessment Report 4 was published I undertook a literature review of all sea level studies, which: projected lower levels than the IPCC Third Assessment Report review; indicated a slowing of the rate of sea level rise; emphasised the role of decadal scale fluctuations; and there was concern about the discrepancy between satellite and tide gauge sea level measurements. It was recognised that, although satellite sensing gives a better overall measurement of global sea level, satellites reported twice the rate of sea level rise being measured at the coast. It was evident that satellite data could not be combined with tide gauge data.

The IPCC Assessment Report 4 report emphasises a single paper, which was not available when I conducted my review, which spliced the satellite data onto the tide gauge data to “find” acceleration in sea level rise over the period of satellite measurement. This is being used to imply that global sea level rise is accelerating due to global warming (now renamedClimate Change). The satellite data only covered the period of increasing sea level associated with decadal cycles, and the known discrepancy between satellite trends and tide gauge trends was not corrected for. This is poor science comparable to the splicing of proxy and instrument data in the infamous Hockey Stick graph, and the splicing of ice core and instrumental CO2 measurements to exaggerate the changes.

Despite therefore finding accelerating sea level rise, the latest IPCC assessment projects lower sea level rises than the previous ones. The methodology used to report the projections was changed to make comparisons harder, but the range of 0.18-0.59 m equates to a most likely rise of around 0.39 m. The IPCC Assessment Report 4 also included an extra 0.20 m allowance for uncertainties associated with destabilisation of the Greenland and West Antarctic Ice Caps. Various groups have speculated that the collapse of these Ice Caps could produce a much higher additional sea level rise. In contrast, published studies that have specifically studied this contribution have concluded that given the worst possible scenarios, the maximum extra contribution is 0.18 m. Hence, the IPCC Assessment Report 4 allowance is a very conservative upper bound.

What has sea level actually done so far this century? There have been large regional variations, but the global rate has slowed and is currently negative, consistent with measured ocean cooling. Claims to the contrary are exaggerations and not realistic.

So, given my understanding of oceanography, what do I believe about climate change? Firstly climate change is real, and has occurred on Earth for at least 4 billion years – as long as an atmosphere and oceans have existed. Climate change occurs in cycles at various time scales, with the shorter time scales known as weather (by convention the distinction is 35 years). Trying to stop or control climate change is akin to stopping ocean tides. Secondly, I believe human activities affect climate, otherwise why would I bother with a mortgage. The climate inside my house is different to the climate that would exist if my house were gone.

There are many ways human activities affect climate on a small scale. Interestingly the concentration of CO2 is not one of them (CO2 are often elevated inside buildings). As the size of the area considered increases, the impact of human activities decreases. As the latest IPCC report notes, there is no convincing evidence of the impact of CO2 (or any other human influence on climate) at a continental scale. Yet, they say that the impact of a CO2 (and other gases treated as effective CO2) is the dominant driver of climate at a global scale and will have catastrophic consequences. This conclusion I strongly disagree with. Why?

It is frequently pointed out that the Earth is approximately 32°C warmer than it would be without an atmosphere due to the Greenhouse Effect. This is misleading, as the climate system responsible for this extra warmth includes many components. Important ones omitted in most discussions are clouds and oceans. About 70 percent of the Earth’s surface is covered in water, which absorbs sunlight and warms up. The oceans retain heat better than land, and, while slow to warm up, they cool slowly and warm the surroundings (a maritime climate).

Considering the available data, it is clear that the oceans warmed over the 20th Century by about the same amount as the atmosphere. This agreement should not be entirely surprising as 70 percent of the mean global air temperature comes from over oceans. The inconvenient truth that is generally ignored, is that the atmosphere is not capable of warming the oceans to any significant degree – 99.9 percent of ocean heat is derived from sunlight at wavelengths less than 3 microns. The balance is mostly from heat leaking from the interior of the Earth. The Greenhouse Effect involves a delay in the loss of infra-red radiation at wavelengths greater than 5 microns.

What does this mean for climate change? It means that variations in the amount of sunlight reaching the oceans will control the rate at which the oceans warm. This is influenced at long time scales by changes in the Earth’s orbit. At short time scales there are changes in the amount of sunlight associated with the sunspot cycle. These changes are small, but due to the ability of the oceans to store heat it may be possible to have a cumulative effect as sunspot cycles wax and wane. However, the main control is the amount of cloud and ice cover. Clouds and sea ice reflect sunlight before it can be absorbed by the oceans, and is referred to as albedo. Albedo changes have a greater influence on climate than the Greenhouse Effect, and are usually invoked to produce the catastrophic consequences of “Climate Change” (aka Accelerated Global Warming).

Oceans lose heat through evaporation (53 percent), infra-red radiation (41 percent) and conduction (6 percent). The Greenhouse Effect can slow the loss of the infra-red radiation, thereby warming the atmosphere but not the oceans. However, evaporation accounts for more than half the heat loss. Evaporation produces clouds, and hence there is a feedback loop – warming the oceans results in more evaporation, producing more clouds, which increases albedo, which cools the oceans. This is exactly what was observed during The Tropical Ocean Global Atmosphere Coupled Ocean Atmosphere Response Experiment (TOGA COARE) that was set up to investigate the Pacific Warm Pool – the warmest ocean water in the western equatorial Pacific Ocean. COARE also found that rainfall would cool the ocean surface, so increased evaporation producing rain is another feedback loop.

What does this have to do with the 20th Century? Well the observed climate change is consistent with variations in albedo and associated ocean warming and cooling, suggesting that it is just a natural cycle. This pattern of behaviour is evident in palaeoclimate data for most of the last 10,000 years. None of this is simulated in climate models. Instead they focus on the 20th Century increase in CO2, CH4 and a few other greenhouse gases. The increasing concentrations correlate well with global temperature. This is taken as proof that the greenhouse effect is driving temperature.

However, it is also correct that changing ocean temperatures affect the concentration of these gases in the atmosphere. At annual and 2-7 year time scales it is clear that the concentration of CO2 in the atmosphere is strongly driven by the ocean. At longer time scales it is also clear that the concentration of greenhouse gases lags behind, and therefore is driven by, temperature. Once again the oceans are the likely control on atmospheric greenhouse gas concentrations. The IPCC position requires that for 50-100 year periods everything works in reverse, which still showing an oceanic influence at shorter timeperiods. It is more likely that the warming of the oceans since the Little Ice Age is a major contributor to the observed increase in CO2. Carbon isotopic ratios indicate that while there is a contribution from the burning of fossil fuels, it is of the order 1-5 percent of the increase.

So, I am a climate realist because the available evidence indicates that climate change is predominantly, if not entirely, natural. It occurs mostly in response to variations in solar heating of the oceans, and the consequences this has for the rest of the Earth’s climate system. There is no evidence to support the hypothesis runaway catastrophic climate change due to human activities.

Monday, April 20, 2009

Antarctic ice is growing, not melting away


Global Research, April 19, 2009
The Australian - 2009-04-18

ICE is expanding in much of Antarctica, contrary to the widespread public belief that global warming is melting the continental ice cap.

The results of ice-core drilling and sea ice monitoring indicate there is no large-scale melting of ice over most of Antarctica, although experts are concerned at ice losses on the continent's western coast.

Antarctica has 90 per cent of the Earth's ice and 80 per cent of its fresh water, The Australian reports. Extensive melting of Antarctic ice sheets would be required to raise sea levels substantially, and ice is melting in parts of west Antarctica. The destabilisation of the Wilkins ice shelf generated international headlines this month.

However, the picture is very different in east Antarctica, which includes the territory claimed by Australia.

East Antarctica is four times the size of west Antarctica and parts of it are cooling. The Scientific Committee on Antarctic Research report prepared for last week's meeting ofAntarctic Treaty nations in Washington noted the South Pole had shown "significant cooling in recent decades". 

Australian Antarctic Division glaciology program head Ian Allison said sea ice losses in west Antarctica over the past 30 years had been more than offset by increases in theRoss Sea region, just one sector of east Antarctica.

"Sea ice conditions have remained stable in Antarctica generally," Dr Allison said.

The melting of sea ice - fast ice and pack ice - does not cause sea levels to rise because the ice is in the water. Sea levels may rise with losses from freshwater ice sheets on the polar caps. In Antarctica, these losses are in the form of icebergs calved from ice shelves formed by glacial movements on the mainland.

Last week, federal Environment Minister Peter Garrett said experts predicted sea level rises of up to 6m from Antarctic melting by 2100, but the worst case scenario foreshadowed by the SCAR report was a 1.25m rise.

Mr Garrett insisted global warming was causing ice losses throughout Antarctica. "I don't think there's any doubt it is contributing to what we've seen both on the Wilkins shelf and more generally in Antarctica," he said.

Dr Allison said there was not any evidence of significant change in the mass of ice shelves in east Antarctica nor any indication that its ice cap was melting. "The only significant calvings in Antarctica have been in the west," he said. And he cautioned that calvings of the magnitude seen recently in west Antarctica might not be unusual.

"Ice shelves in general have episodic carvings and there can be large icebergs breaking off - I'm talking 100km or 200km long - every 10 or 20 or 50 years."

Ice core drilling in the fast ice off Australia's Davis Station in East Antarctica by the Antarctic Climate and Ecosystems Co-Operative Research Centre shows that last year, the ice had a maximum thickness of 1.89m, its densest in 10 years. The average thickness of the ice at Davis since the 1950s is 1.67m.

A paper to be published soon by the British Antarctic Survey in the journal Geophysical Research Letters is expected to confirm that over the past 30 years, the area of sea ice around the continent has expanded.

Wednesday, April 8, 2009

Global Warming Contradiction from NASA: Deep Solar Minimum

NASA

+ Play Audio | + Download Audio | + Email to a friend | + Join mailing list

April 1, 2009: The sunspot cycle is behaving a little like the stock market. Just when you think it has hit bottom, it goes even lower.

2008 was a bear. There were no sunspots observed on 266 of the year's 366 days (73%). To find a year with more blank suns, you have to go all the way back to 1913, which had 311 spotless days: plot. Prompted by these numbers, some observers suggested that the solar cycle had hit bottom in 2008.

Maybe not. Sunspot counts for 2009 have dropped even lower. As of March 31st, there were no sunspots on 78 of the year's 90 days (87%).

It adds up to one inescapable conclusion: "We're experiencing a very deep solar minimum," says solar physicist Dean Pesnell of the Goddard Space Flight Center.

"This is the quietest sun we've seen in almost a century," agrees sunspot expert David Hathaway of the Marshall Space Flight Center.

ssn_predict_l.gif

Above: The sunspot cycle from 1995 to the present. The jagged curve traces actual sunspot counts. Smooth curves are fits to the data and one forecaster's predictions of future activity. Credit: David Hathaway, NASA/MSFC. [more]

Quiet suns come along every 11 years or so. It's a natural part of the sunspot cycle, discovered by German astronomer Heinrich Schwabe in the mid-1800s. Sunspots are planet-sized islands of magnetism on the surface of the sun; they are sources of solar flares, coronal mass ejections and intense UV radiation. Plotting sunspot counts, Schwabe saw that peaks of solar activity were always followed by valleys of relative calm—a clockwork pattern that has held true for more than 200 years: plot.

The current solar minimum is part of that pattern. In fact, it's right on time. "We're due for a bit of quiet—and here it is," says Pesnell.

But is it supposed to be this quiet? In 2008, the sun set the following records:

A 50-year low in solar wind pressure: Measurements by the Ulysses spacecraft reveal a 20% drop in solar wind pressure since the mid-1990s—the lowest point since such measurements began in the 1960s. The solar wind helps keep galactic cosmic rays out of the inner solar system. With the solar wind flagging, more cosmic rays are permitted to enter, resulting in increased health hazards for astronauts. Weaker solar wind also means fewer geomagnetic storms and auroras on Earth.

A 12-year low in solar "irradiance": Careful measurements by several NASA spacecraft show that the sun's brightness has dropped by 0.02% at visible wavelengths and 6% at extreme UV wavelengths since the solar minimum of 1996. The changes so far are not enough to reverse the course of global warming, but there are some other significant side-effects: Earth's upper atmosphere is heated less by the sun and it is therefore less "puffed up." Satellites in low Earth orbit experience less atmospheric drag, extending their operational lifetimes. Unfortunately, space junk also remains longer in Earth orbit, increasing hazards to spacecraft and satellites.

irradiance.jpg

Above: Space-age measurements of the total solar irradiance (brightness summed across all wavelengths). This plot, which comes from researcher C. Fröhlich, was shown by Dean Pesnell at the Fall 2008 AGU meeting during a lecture entitled "What is Solar Minimum and Why Should We Care?"

A 55-year low in solar radio emissions: After World War II, astronomers began keeping records of the sun's brightness at radio wavelengths. Records of 10.7 cm flux extend back all the way to the early 1950s. Radio telescopes are now recording the dimmest "radio sun" since 1955: plot. Some researchers believe that the lessening of radio emissions is an indication of weakness in the sun's global magnetic field. No one is certain, however, because the source of these long-monitored radio emissions is not fully understood.

All these lows have sparked a debate about whether the ongoing minimum is "weird", "extreme" or just an overdue "market correction" following a string of unusually intense solar maxima.

"Since the Space Age began in the 1950s, solar activity has been generally high," notes Hathaway. "Five of the ten most intense solar cycles on record have occurred in the last 50 years. We're just not used to this kind of deep calm."

Deep calm was fairly common a hundred years ago. The solar minima of 1901 and 1913, for instance, were even longer than the one we're experiencing now. To match those minima in terms of depth and longevity, the current minimum will have to last at least another year.

In a way, the calm is exciting, says Pesnell. "For the first time in history, we're getting to see what a deep solar minimum is really like." A fleet of spacecraft including the Solar and Heliospheric Observatory (SOHO), the twin STEREO probes, the five THEMIS probes, Hinode, ACE, Wind, TRACE, AIM, TIMED, Geotail and others are studying the sun and its effects on Earth 24/7 using technology that didn't exist 100 years ago. Their measurements of solar wind, cosmic rays, irradiance and magnetic fields show that solar minimum is much more interesting and profound than anyone expected.

imgres.jpg

Above: An artist's concept of NASA's Solar Dynamics Observatory. Bristling with advanced sensors, "SDO" is slated to launch later this year--perfect timing to study the ongoing solar minimum. [more]

Modern technology cannot, however, predict what comes next. Competing models by dozens of top solar physicists disagree, sometimes sharply, on when this solar minimum will end and how big the next solar maximum will be. Pesnell has surveyed the scientific literature and prepared a "piano plot" showing the range of predictions. The great uncertainty stems from one simple fact: No one fully understands the underlying physics of the sunspot cycle.

Pesnell believes sunspot counts will pick up again soon, "possibly by the end of the year," to be followed by a solar maximum of below-average intensity in 2012 or 2013.

But like other forecasters, he knows he could be wrong. Bull or bear? Stay tuned for updates.

Friday, March 27, 2009

U.N. ‘Climate Change’ Plan Would Likely Shift Trillions to Form New World Economy

George Russell 
Fox News
March 27, 2009

A United Nations document on “climate change” that will be distributed to a major environmental conclave next week envisions a huge reordering of the world economy, likely involving trillions of dollars in wealth transfer, millions of job losses and gains, new taxes, industrial relocations, new tariffs and subsidies, and complicated payments for greenhouse gas abatement schemes and carbon taxes — all under the supervision of the world body.

Those and other results are blandly discussed in a discretely worded United Nations “information note” on potential consequences of the measures that industrialized countries will likely have to take to implement the Copenhagen Accord, the successor to the Kyoto Treaty, after it is negotiated and signed by December 2009. The Obama administration has said it supports the treaty process if, in the words of a U.S. State Department spokesman, it can come up with an “effective framework” for dealing with global warming.

The 16-page note, obtained by FOX News, will be distributed to participants at a mammoth negotiating session that starts on March 29 in Bonn, Germany, the first of three sessions intended to hammer out the actual commitments involved in the new deal.

Read entire article

Monday, March 9, 2009

Climate ‘denial’ is now a mental disorder

Christopher Booker
Telegraph
March 7, 2009

How odd that, last Monday, none of our media global warming groupies should have bothered to report what was billed to be “the largest ever demonstration for civil disobedience over climate change”. There was talk of hundreds of thousands of protestors converging on Washington to hear Jim Hansen, the scientist who talks of coal-fired power stations as “factories of death”, call yet again for all coal plants to be closed. Perhaps the lack of coverage was due to the fact that, before Hansen arrived to address a forlorn group of several hundred hippies, Washington was blanketed in nearly a foot of snow.

It was generally another bad week for the warmists. The Met Office, which has been one of the chief pushers of the global warming scare for 20 years, had to admit that this has been “Britain’s coldest winter for 13 years”, despite its prediction last September that the winter would be “milder than average”. This didn’t of course stop it predicting that 2009 will be one of “the top-five warmest years on record”.

US climate sceptics such as those on the Watts Up With That website, for whom the predictions of the UK Met Office have become a regular source of amusement, recalled its forecast that 2007 would be “the warmest year on record globally”, just before global temperatures dived by nearly a full degree Celsius, cancelling out the entire net warming of the past 100 years.

Read entire article

The real ‘deniers’

Lorne Gunter
National Post
March 9, 2009

William Happer is hardly a climate change “denier.” A physics professor at Princeton, he is a former director of energy research for the U. S. Department of Energy, where he supervised work on climate change between 1990 and 1993. He is also one of the world’s leading experts on “the interactions of visible and infrared radiation with gases,” and on carbon dioxide and the greenhouse effect. Two weeks ago, he told the U. S. Congress, “I believe the increase of CO2 (in the atmosphere) is not a cause for alarm.”

Claims that an increase of atmospheric CO2 will lead to catastrophic warming “are wildly exaggerated,” according to Prof. Happer. While a doubling (we have seen about a 35% rise since the beginning of the Industrial Revolution) might lead to a 0.6C rise in global temperature, he told Congress, “additional increments of CO2 will cause relatively less direct warming because we already have so much CO2 … that it has blocked most of the infrared radiation that it can.”

Prof. Happer added that while CO2 concentrations have risen steadily for more than 100 years, warming began before that — 200 years ago — and even during the time when temperatures and carbon concentrations have risen together, the link has hardly been consistent. For instance, while CO2 was rising rapidly from 1950 to 1970, temperatures were going through an especially cold period.

Read entire article