
* Carbon dioxide contributes to only 4.2 - 8.4% of the greenhouse gas effect
* Only approximately 4% of carbon dioxide is man-made
* Water vapor accounts for 90 - 95% of the green house gas effect
* 99.99% of water vapor is natural, meaning that no amount of deindustrialization could get rid of it
* There have been many times when the temperature has been higher than it is now including the Medieval Warming Period, the Holocene, the Jurassic, and the Eemian
* Increases in carbon dioxide follow increases in temperature by about 800 years, not precede them
* Phil Jones of the Hadley CRU, and key figure in the "climategate" scandal, admits that there has been no "statistically significant" global warming since 1995
* 2008 and 2009 were the coolest two years of the decade
* During the Ordovician period carbon dioxide concentrations were twelve times what they are now, and the temperature was lower
* Solar activity is highly correlated with temperature change:

* Studies show that half of all recent warming was solar
* Mars has warmed about 0.5°C since the 1970's, approximately the same that earth has warmed over the same period
* The 0.7°C increase in temperatures over the last century is entirely consistent with well-established, long-term, natural climate trends
* The distance between Earth and Sun changes every year, affecting the amount of energy the earth receives
* Earth’s tilt oscillates between 21.4° and 24.8°, which affects the distribution of the sun's energy
* Dr. Roy Spencer has written that clouds have been a more important driver of climate than carbon dioxide since 2000
* Approximately 40% of the uncertainty in temperature projections come from uncertainty in the strength of the "feedback loop" between temperature and carbon dioxide. Recent research suggests the "feedback loop" is less than half as strong than many had presumed
* James Hansen of NASA said in a simulation of temperatures from 1880 to 2000 soot accounted for 25% of observed global warming
* Research suggests that soot could have nearly as much impact on climate change as carbon dioxide
* Antarctica has 90% of earth's ice and it is growing
* Arctic sea ice has returned to 1979 levels, which is when records began
* The Arctic ice caps have recovered from their loss in 2007
* The Arctic is now 1°C cooler than it was in the 1940's
* Polar bear populations are increasing
* Polar bears are able to swim over 60 miles continuously
* Sea level 81,000 years ago was 1 meter higher than it is now while carbon dioxide levels were lower
* A chart of sea level change over millions of years looks like this:

* According to satellite data, sea level has been decreasing since 2005
* Instead of hurting forests, the increased level of carbon dioxide has been helping them grow
* The official "record" for temperatures only goes back 150 years
* Although the IPCC may have 2500 members, only approximately 800 contribute to the scientific writing of the report
* Only 52 scientists contributed to the 2007 IPCC summary for policy makers, although diplomats from over 115 countries contributed
* Only 20% of the members of the IPCC deal with climate science
* Head of the IPCC, Dr. Rajendra Pachauri has no background in climate science. His PhD is in economics and he worked as a railway engineer before becoming head of the IPCC
* Former IPCC lead author Ben Santer openly admits that he altered portions of the 1995 IPCC report to make them "consistent with the other chapters"
* John Christy, former lead author on the 2001 IPCC report, speaks of his former co-lead authors deliberately trying to sensationalize the report
*Richard Lindzen, another lead author on the 2001 IPCC report, accused the IPCC of being "driven by politics"
* Michael Mann's "hockey stick" graph, which was featured prominently in the 2001 IPCC report, was created using only portions of a data set. The red line is the graph of Mann's selected data, while the black line is the graph of all the data:

* When asked to act as an expert reviewer on the IPCC's last two reports, Dr. Nils Axel-Morner was "astonished to find that not one of their 22 contributing authors on sea levels was a sea level specialist"
* Until 2003, the IPCC's satellite-based evidence showed no upward trend in sea level, so they used an increase of 2.3mm in one Hong Kong tide-gauge to adjust the entire global sea level up 2.3mm
* The IPCC's claim that the Himalayan glaciers were melting was based off of a phone interview with a non-scientist. They were forced to retract the claim
* The IPCC claim that global warming was led to increased natural disasters was based on an unpublished report that had not been subject to peer-review. They were forced to retract the claim
* The IPCC's claim that global warming was going to lead to deficiencies of up to 50% in African agriculture was based on a non-peer-reviewed and non-scientific paper. They were forced to retract the claim
* The IPCC's claim that "up to 40% of the Amazonian forests could react drastically to even a slight reduction in precipitation" was based on a non-peer-reviewed and non-scientific paper. They were forced to retract the claim
* The IPCC reported that 55% of the Netherlands was below sea level when just 26% of the country is below sea level. They were later forced to retract the claim
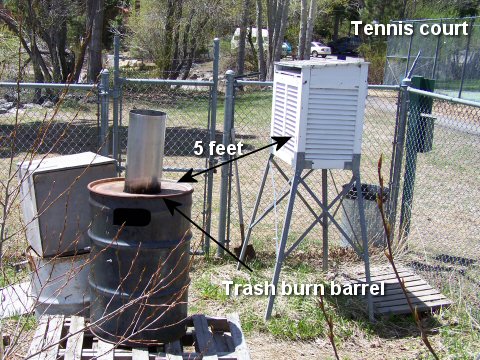
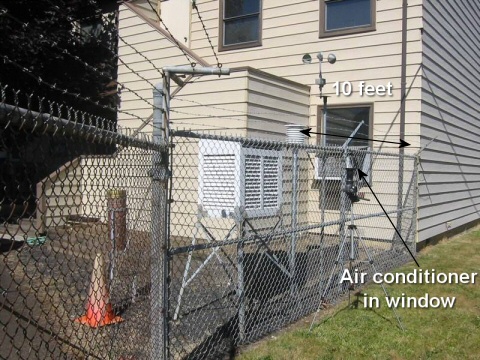
* According to the United States Historical Climatology Network (USHNC,) 90% of US climate-monitoring surface stations have been found to be "poorly situated," meaning that they have a margin of error greater than 1°C, more than the global warming in the entire 20th century. (The US surface data is generally considered the best surface data in the world):

* Many climate-monitoring surface stations are in locations that look like this:

* Temperature measurements from climate-monitoring surface stations are collected by hand. At one surface station in California, Anthony Watts found that only data from 14 out of 31 days had been completed in a month
* If a surface station is missing data for a particular day, data from surrounding surface stations is used to fill-in. Since 90% of all surface stations are poorly situated, even if a surface station itself is not poorly situated, if its data is missing for a day, there is a very good chance its temperature will be calculated using data from surface stations that are poorly situated
* In April 1978, there were 6,000 climate-monitoring surface stations. There are now about 1,200
* The vast majority of climate-monitoring stations that were lost were rural ones, which have been shown to give the most accurate data:


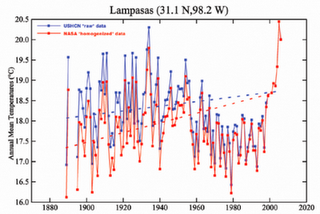
* Difference between the USHCN "raw" data (in blue) and NASA "homogenized" data (in red):
* According to a leaked email in "climategate," "temperatures in Darwin [a monitoring station in Australia] were falling at 0.7 Celsius per century […]but after the homogenization, they were warming at 1.2 Celsius per century. [...][W]hen those guys “adjust,” they don’t mess around."
* According to a leaked email in "climategate," computer programmer Harry Harris called the CRU data set "hopeless," and said "the rest of the databases seem to be in nearly as poor a state as Australia was. [...]This whole project is SUCH A MESS. No wonder I needed therapy!!"
* When looking at source code leaked in "climategate" used to "process" and "adjust" temperatures, software engineer John Graham-Cumming said he found at least five errors and "wouldn't trust it"
* The Hadley CRU, the institution at the center of the "climategate" scandal, threw out original temperature data because it claimed it did not have "storage space"
* In 1990, Dr. Phil Jones, the man at the center of the "climategate" scandal, contributed to a paper arguing that the effect of urban warming in eastern China was "negligible." This became a key reference source for the IPCC. It turns out that 49 of the 84 climate-monitoring stations used for this report had no history of their locations or other details. This included 40 of the 42 rural stations. Of the rest, 18 had "certainly been moved" during the study period, including one that was moved five times over a total distance of 41 km. When Jones "re-examined" data in the same area for a 2008 paper, he found that urbanization was responsible for 40% of the warming found from 1951 to 2004
* Ross McKitrick and Patrick Michaels have argued that half of the global warming trend from 1980 to 2002 is caused by urban warming
* The Hadley CRU has been accused of using data from just 25% of Russia's surface stations, deliberately overstating Russia's warming by .64°C between the 1870's and 1990's
* According to emails leaked in "climategate," when "Climate Research" published articles by global warming skeptics, Phil Jones and others urged scientists to "stop considering 'Climate Research' as a legitimate peer-reviewed journal"
* William Connolly, a Wikipedia administrator and co-founder of Realclimate.org, a website that supports the theory of anthropogenic global warming, "touched" over 5,400 Wikipedia articles, routinely omitting voices that were skeptical of global warming
* Large computer climate models are unable to even simulate major features of past climate such as the 100 thousand year cycles of ice ages that have dominated climate for the past 700 thousand years
* This is a picture of what Britain looked like in the summer of 2009 when its sophisticated climate "supercomputer" had predicted a "barbeque summer":

* The US government spends over $2.5B funding climate research every year, and over $7B when grants for technology, tax breaks, and foreign aid are included (this is while Exxon gave $22M to global warming skeptics over a 10 year period)
* Many scientist assert that government grant money is given preferentially to advocates of man-made global warming
* Bart Chilton, a CFTC commissioner, said "carbon markets could be worth $2 trillion in transaction value – [...]within five years of trading (starting). [...]That would make it the largest physically traded commodity in the US, surpassing even oil"
* The owners of the trading floor where the carbon credits will be traded, including Goldman Sachs and Al Gore, stand to earn trillions if cap-and-trade is passed
* The cap-and-trade bill allows the government police powers to come into your home and inspect it for "energy efficiency," and to fine you every day your home is not compliant
* Australian homes now have to undergo a mandatory energy-efficiency assessment - costing up to $1500 per property - before they can be sold or rented under new laws to tackle carbon emissions
* UN Secretary General Ban Ki-Moon has called for "global governance structure" to monitor greenhouse gases, which everyone on the planet emits with every exhale
* The United Nations forecasts that the global population will rise, peak and then decline between 2050 and 2300 to just under 9 billion
* Despite proclamations that there is a "consensus" and the debate is "settled," 18% of scientists surveyed in the last poll trying to discern scientific opinion do not believe in man-made global warming
* 45% of Americans think global warming is man-made, down 9% from just half a year earlier
* In the court case Dimmock v Secretary of State for Education and Skills, a British judge ruled that there were nine "inaccuracies" in An Inconvenient Truth, including Gore's claim that sea level could rise by up to 20 ft. The IPCC's own report predicted a maximum rise of 59cm in sea level over 100 years. The Science and Public Policy Institute has taken issue with thirty five of Gore's claims in An Inconvenient Truth
* Al Gore bought a $4M condo feet from ocean in Fisherman's Wharf, San Fransisco, a city he had explicitly warned about in An Inconvenient Truth


